





Not surveys. Real team actions

See who yourteam relies onbefore they leave

HiveHR shows who really keeps the team moving: whose hands knowledge and decisions pass through, who is overloaded, who quietly pulls the company forward, and where processes depend on a person instead of a system.

Read verified HiveHR reviews on Capterra →

Three management questions
HiveHR answers

The same organization looks different to HR, C-level leaders, and operations.

HR

Who helps the team hold together every day?

HiveHR reveals people whose contribution is rarely visible in formal reports: hidden mentors, informal leaders, overloaded employees, and those the team values for help, expertise, and responsibility.

  • who to develop
  • who to retain
  • who influences without a formal title
CEO

Where does the business depend too much on individuals?

HiveHR shows who knowledge, decisions, and responsibility pass through, and where weak links, manual processes, or a key person's departure can create business risk.

  • where processes depend on people
  • which areas do not scale well
  • where risk should be seen early
COO

Where do processes get stuck between departments?

HiveHR helps you understand which teams interact weakly, where problems repeat, who actually moves decisions forward, and which ideas or failures should be addressed first.

  • where processes stall
  • who helps changes spread
  • which problems keep repeating

The biggest risks are rarely
visible on the org chart

KPIs, reports, and survey results show a snapshot, not the living work of the company.

Every day the team produces signals about help, overload, weak connections, recurring problems, and ideas for improvement.

Usually, these signals are not collected anywhere.

HiveHR gathers them in one place and turns them into a foundation for management decisions.

01

Who helps colleagues solve tasks faster and passes knowledge between departments.

02

Who notices process problems first and suggests practical improvements.

03

Who is overloaded because everyone comes to them for help and complex decisions.

04

Which departments interact weakly and where changes may get stuck.

How HiveHR captures signals
that reports miss

Employees do not fill out long questionnaires. They make simple work actions, and HiveHR reads signals about people, connections, and risks from them.

Action

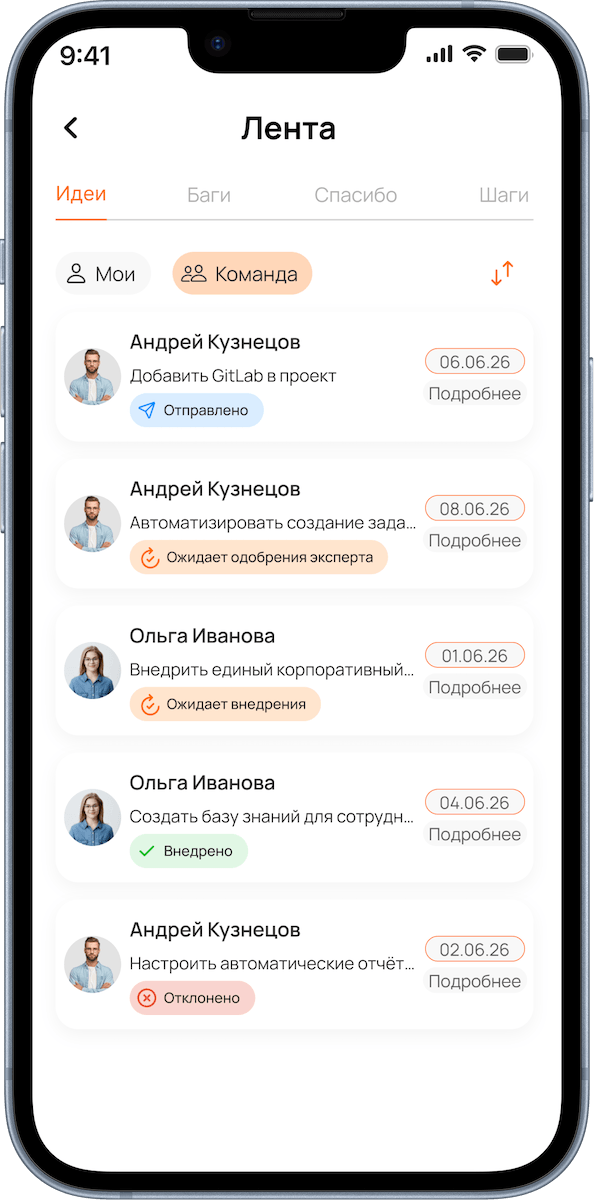
An employee thanks a colleague, suggests an idea, or highlights a problem.

Signal

HiveHR reads the meaning: help, expertise, initiative, risk, connection.

Picture

The dashboard shows who creates value, who connects teams, and where problems accumulate.

Decision

You understand who to support, where to strengthen connections, and what needs attention.

Three data sources

Each mechanism creates a separate information stream about the team's state.

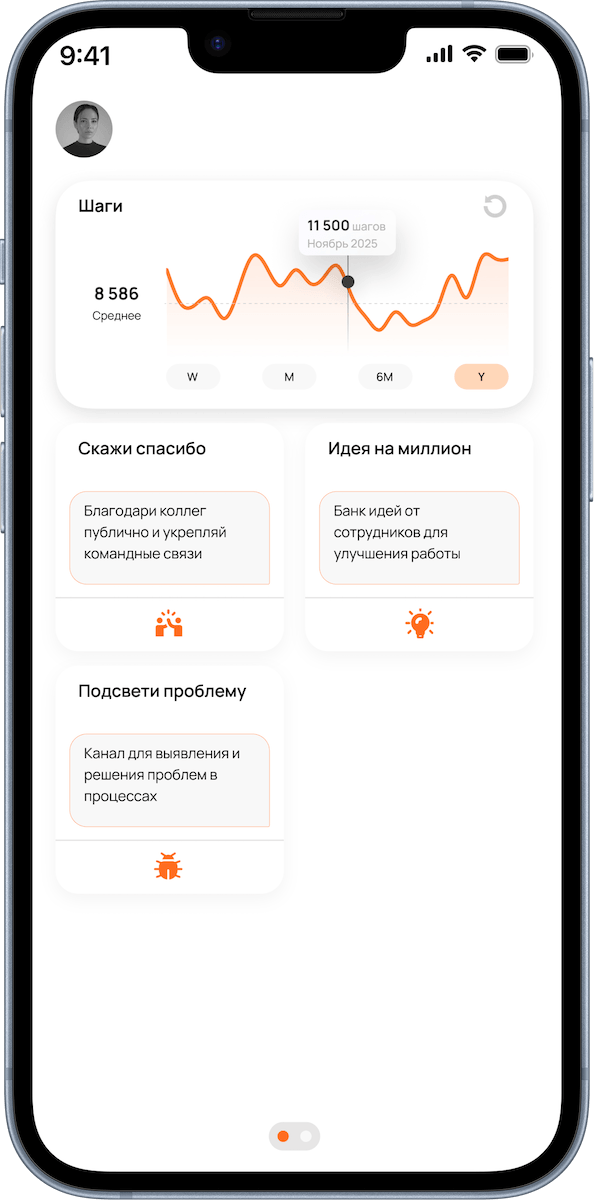
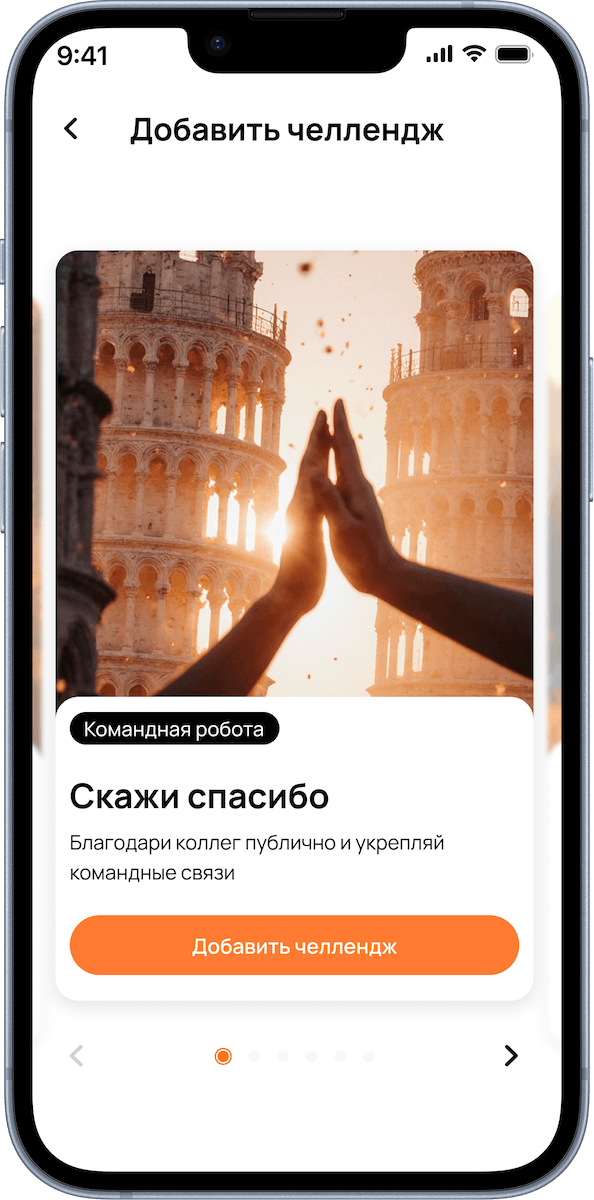
01Say thanks

Who helps, mentors, shares expertise, and keeps connections between teams alive.

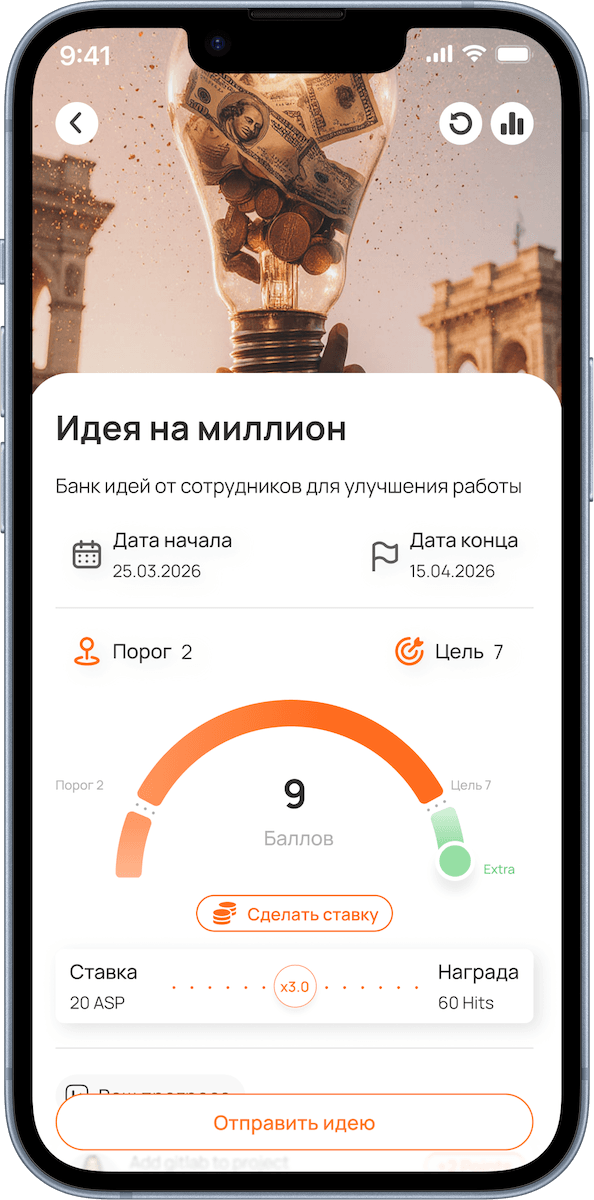
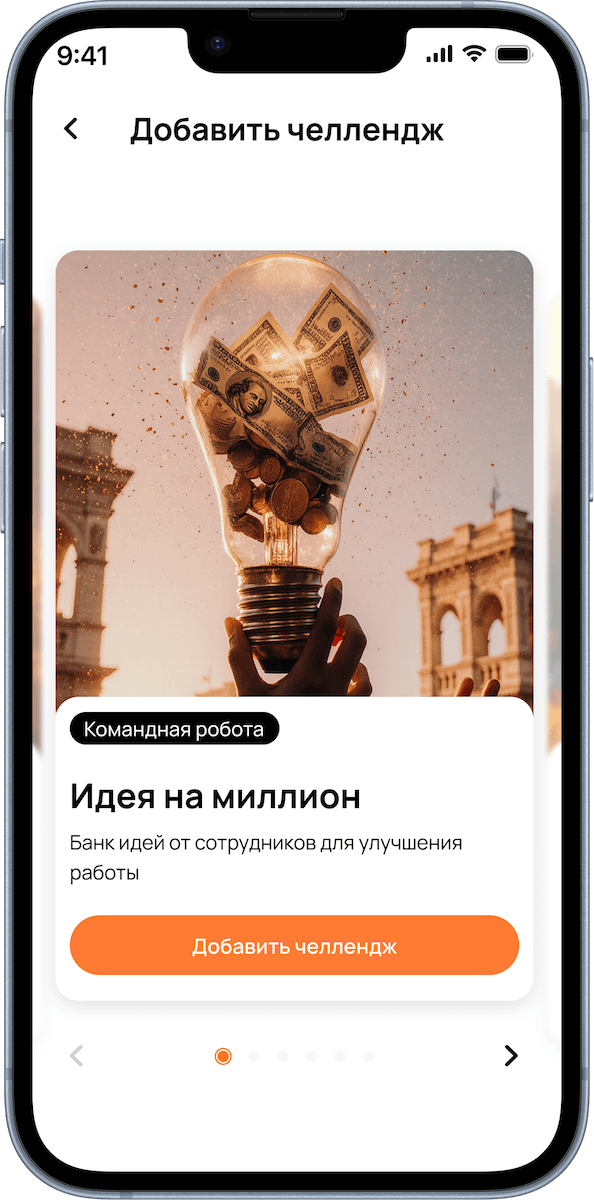
02Million-dollar idea

Who sees growth opportunities, which themes repeat, and what reaches implementation.

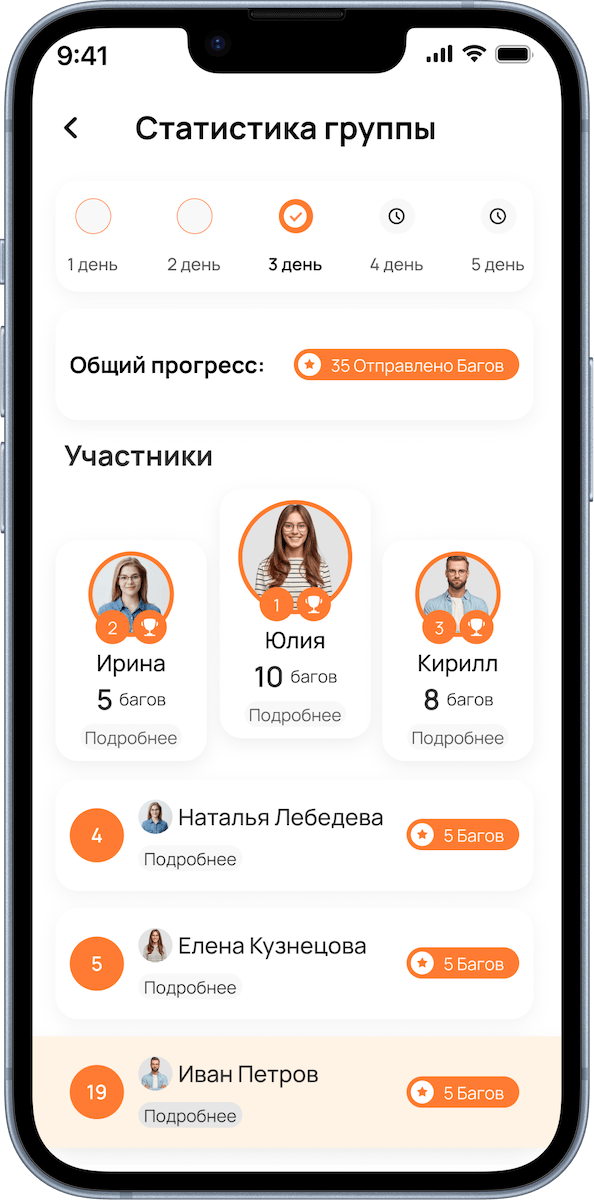
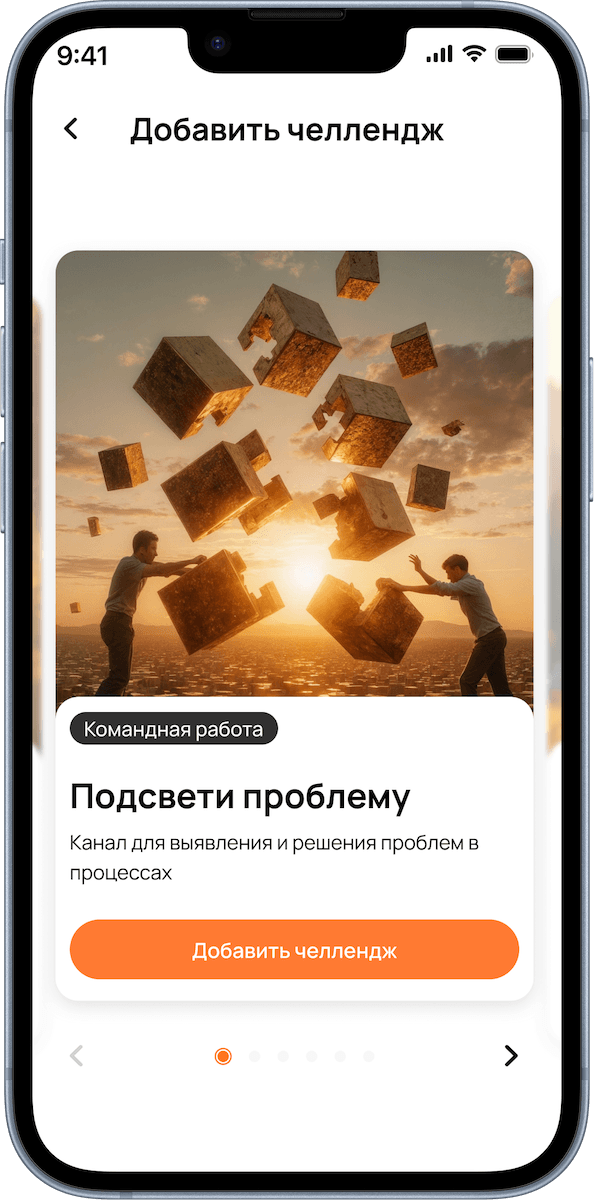
03Highlight a problem

Where bottlenecks appear, which difficulties repeat, and who notices risks.

This is the basic pilot set. If needed, HiveHR can add learning, quizzes, wellbeing challenges, QR quests, and regular team activities.

Competencies that already exist inside the company

From the same signals, HiveHR builds each employee's profile, not by title, but by what they actually do for the team.

Which competencies already exist inside the company

HiveHR shows real skills, expertise, and strengths that appear in help, ideas, and solving work problems.

Who carries key expertise

You see who the team turns to for knowledge, who helps colleagues move faster, and who important processes rely on.

What competencies are worth to the business

You understand which employees create the most value for the team. This helps make sharper decisions about development, retention, and knowledge transfer.

What becomes visible in 30 days

HiveHR turns team signals into a map of contribution, connections, competencies, leaders, risks, and action priorities.

Contribution map
Who helps, suggests ideas, takes responsibility, and creates value.
Informal leaders
People through whom help, knowledge, and influence flow, regardless of title.
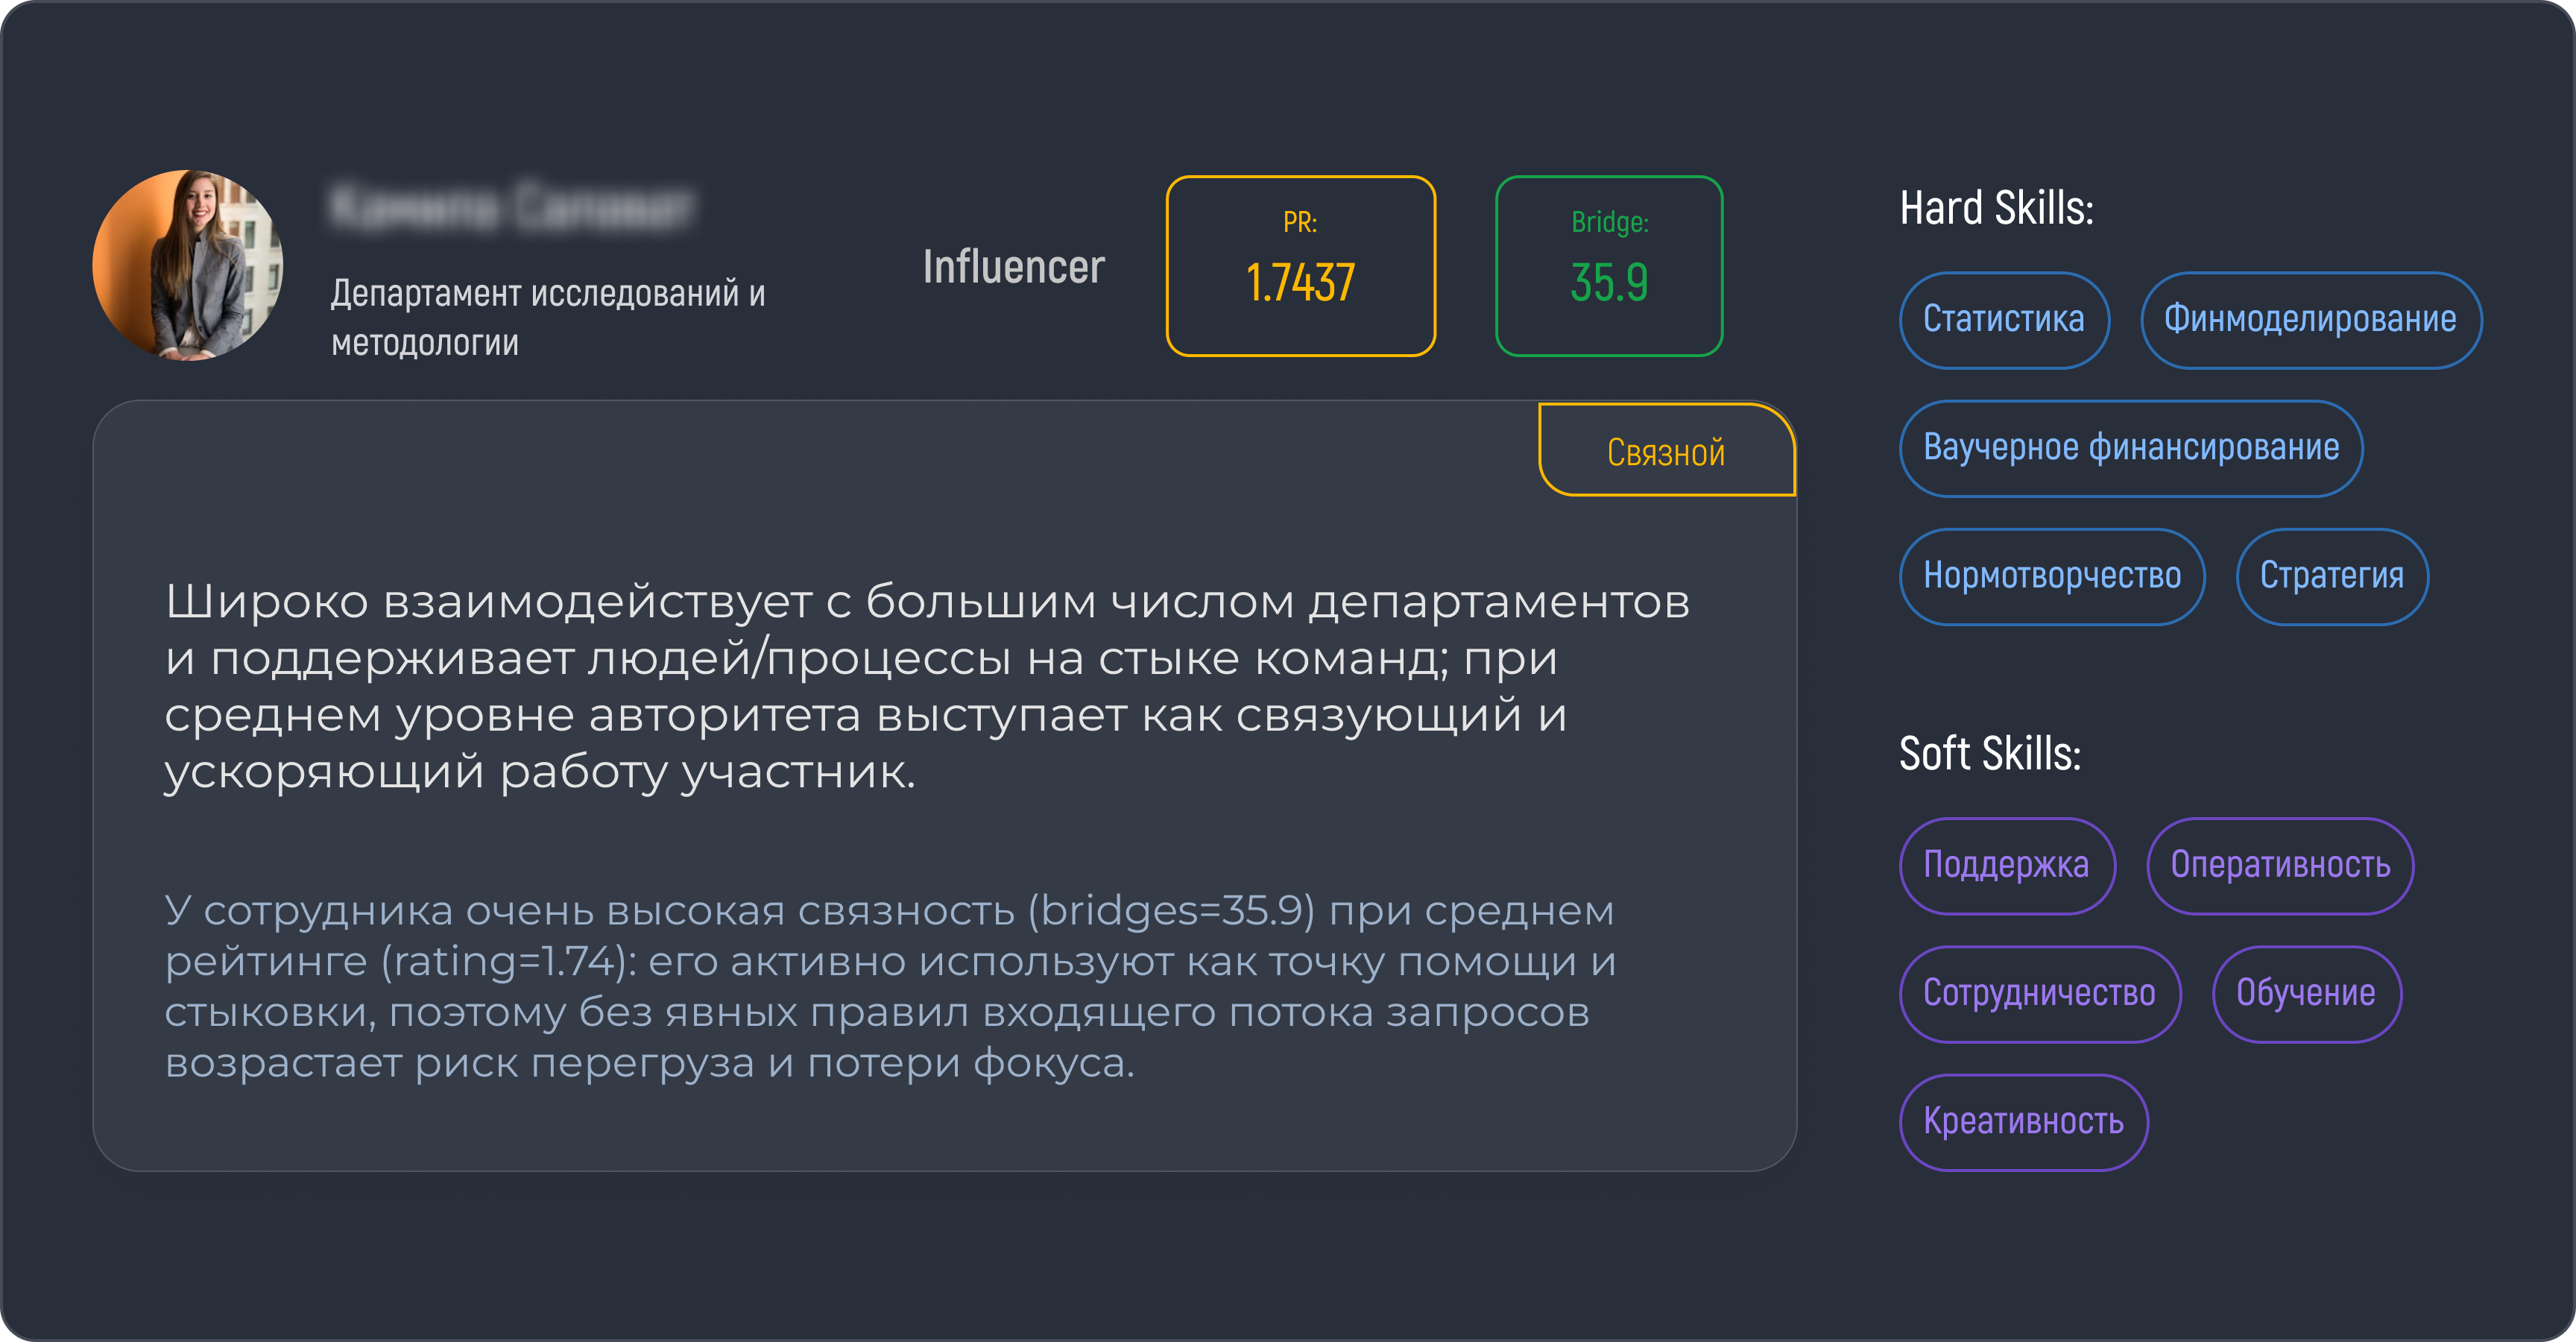
Employee profiles
What the team truly values a person for: competencies, skills, and areas of expertise.
Risk zones
Overload, recurring problems, dependence on key employees.
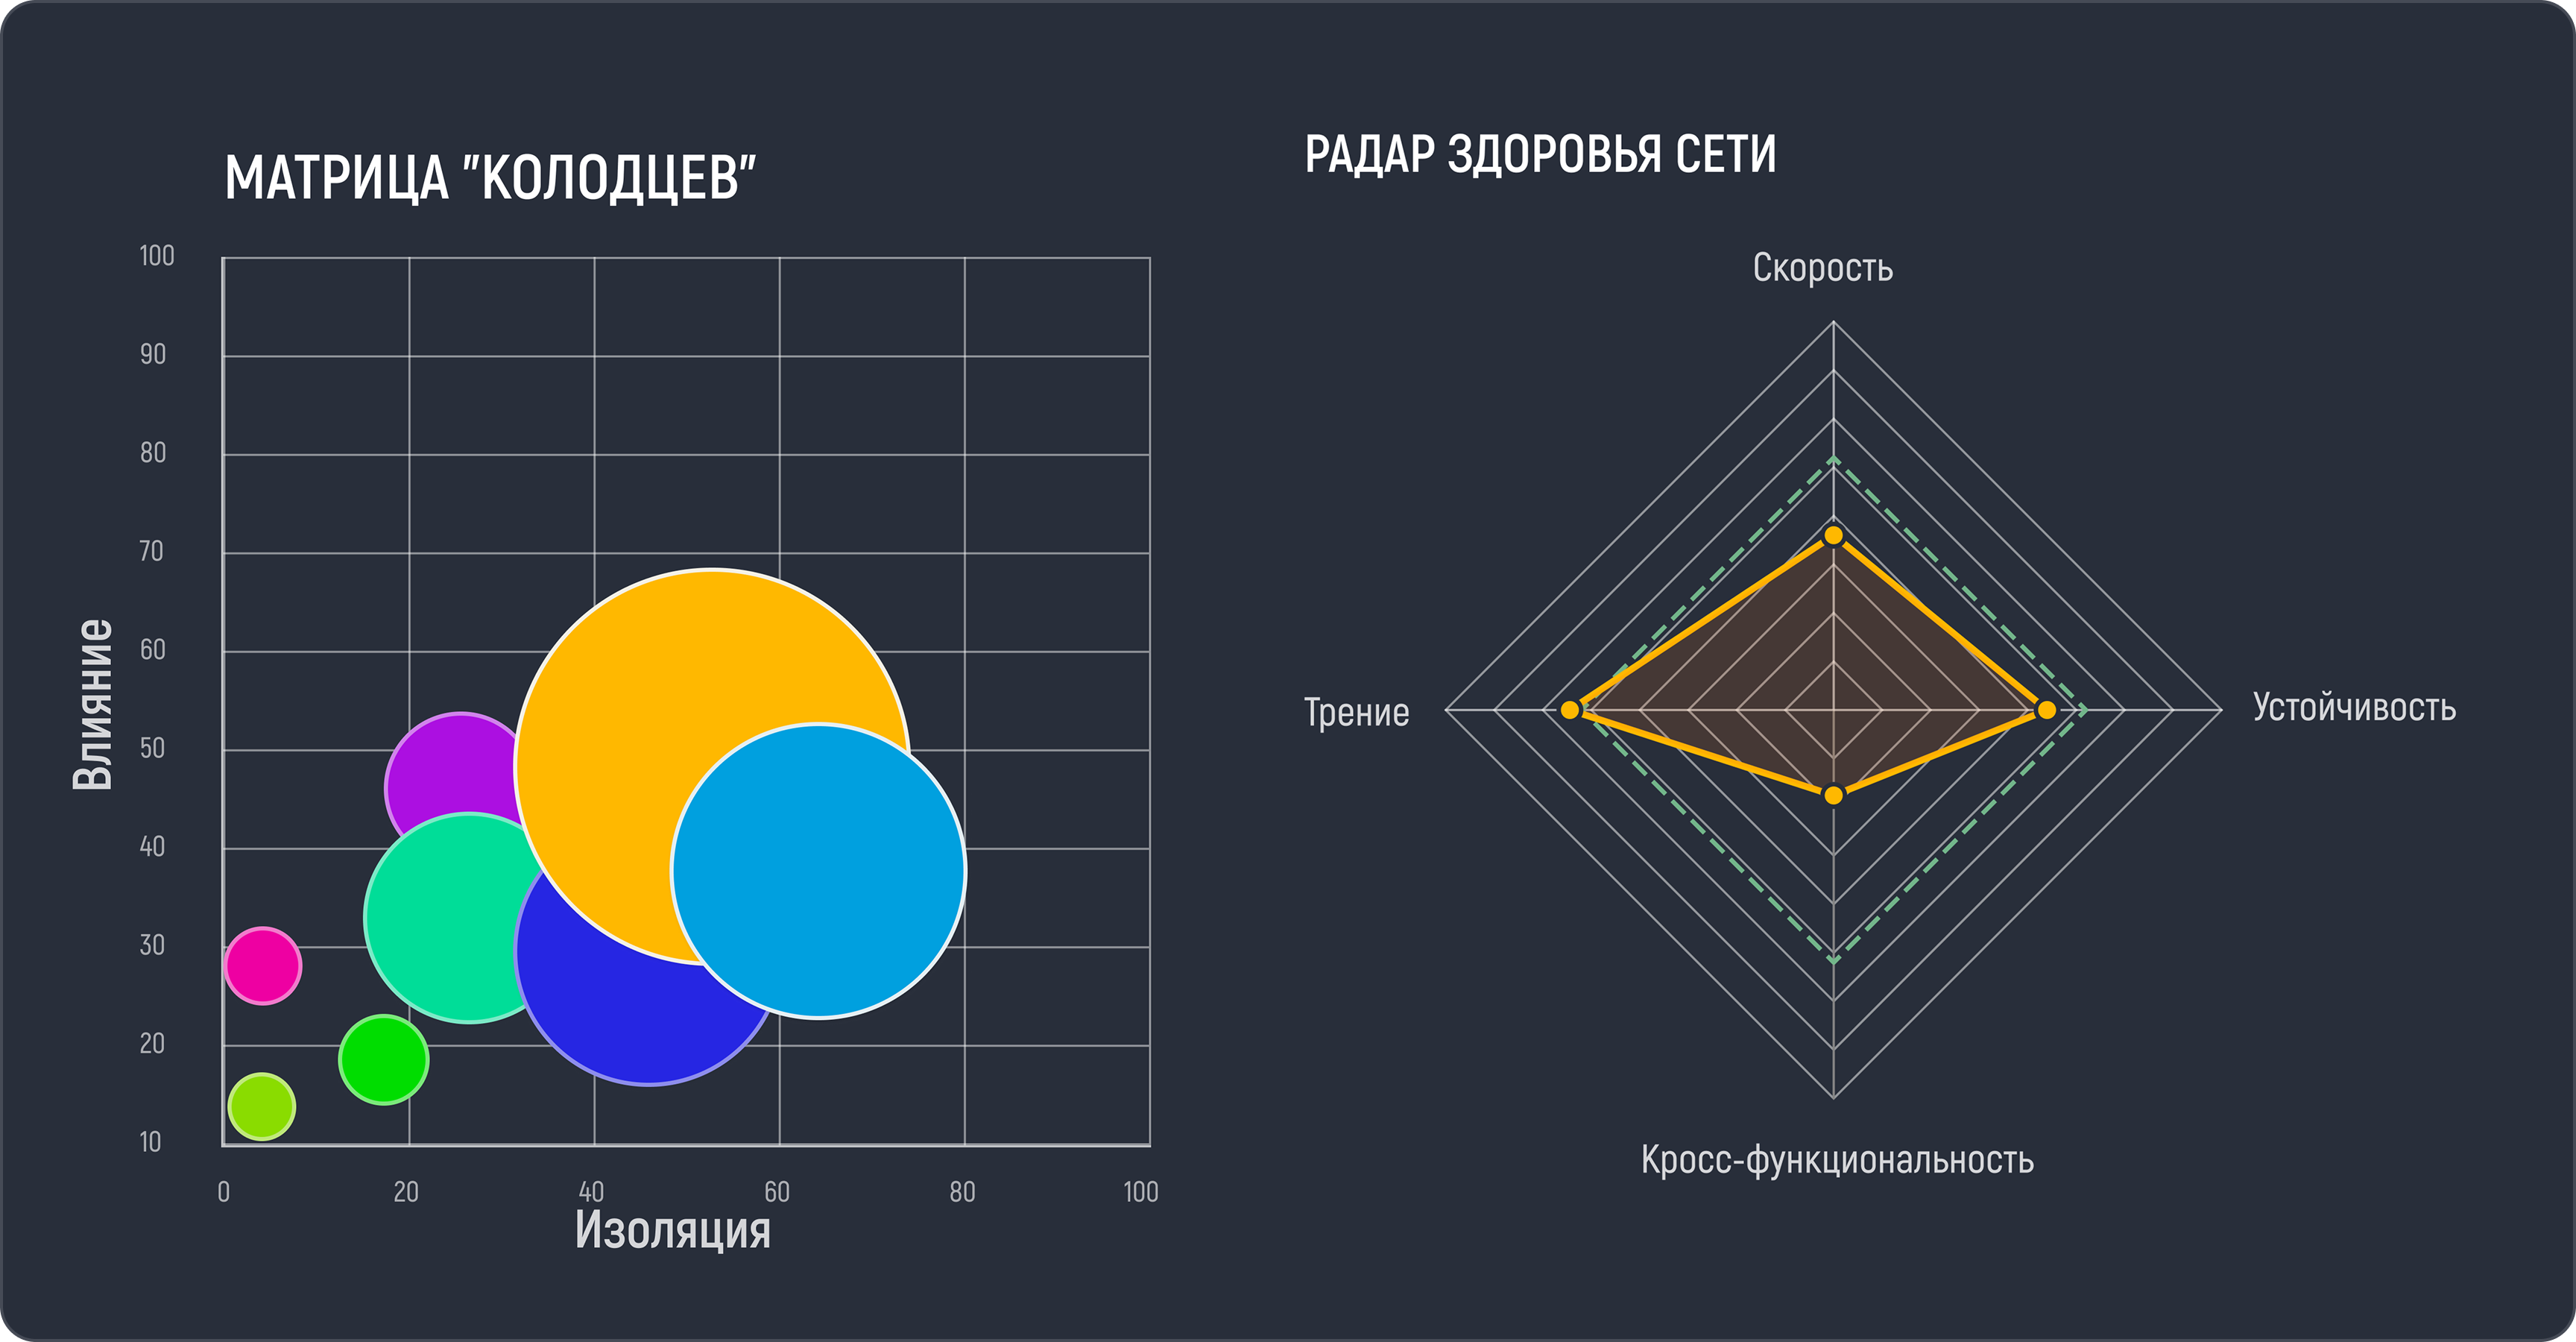
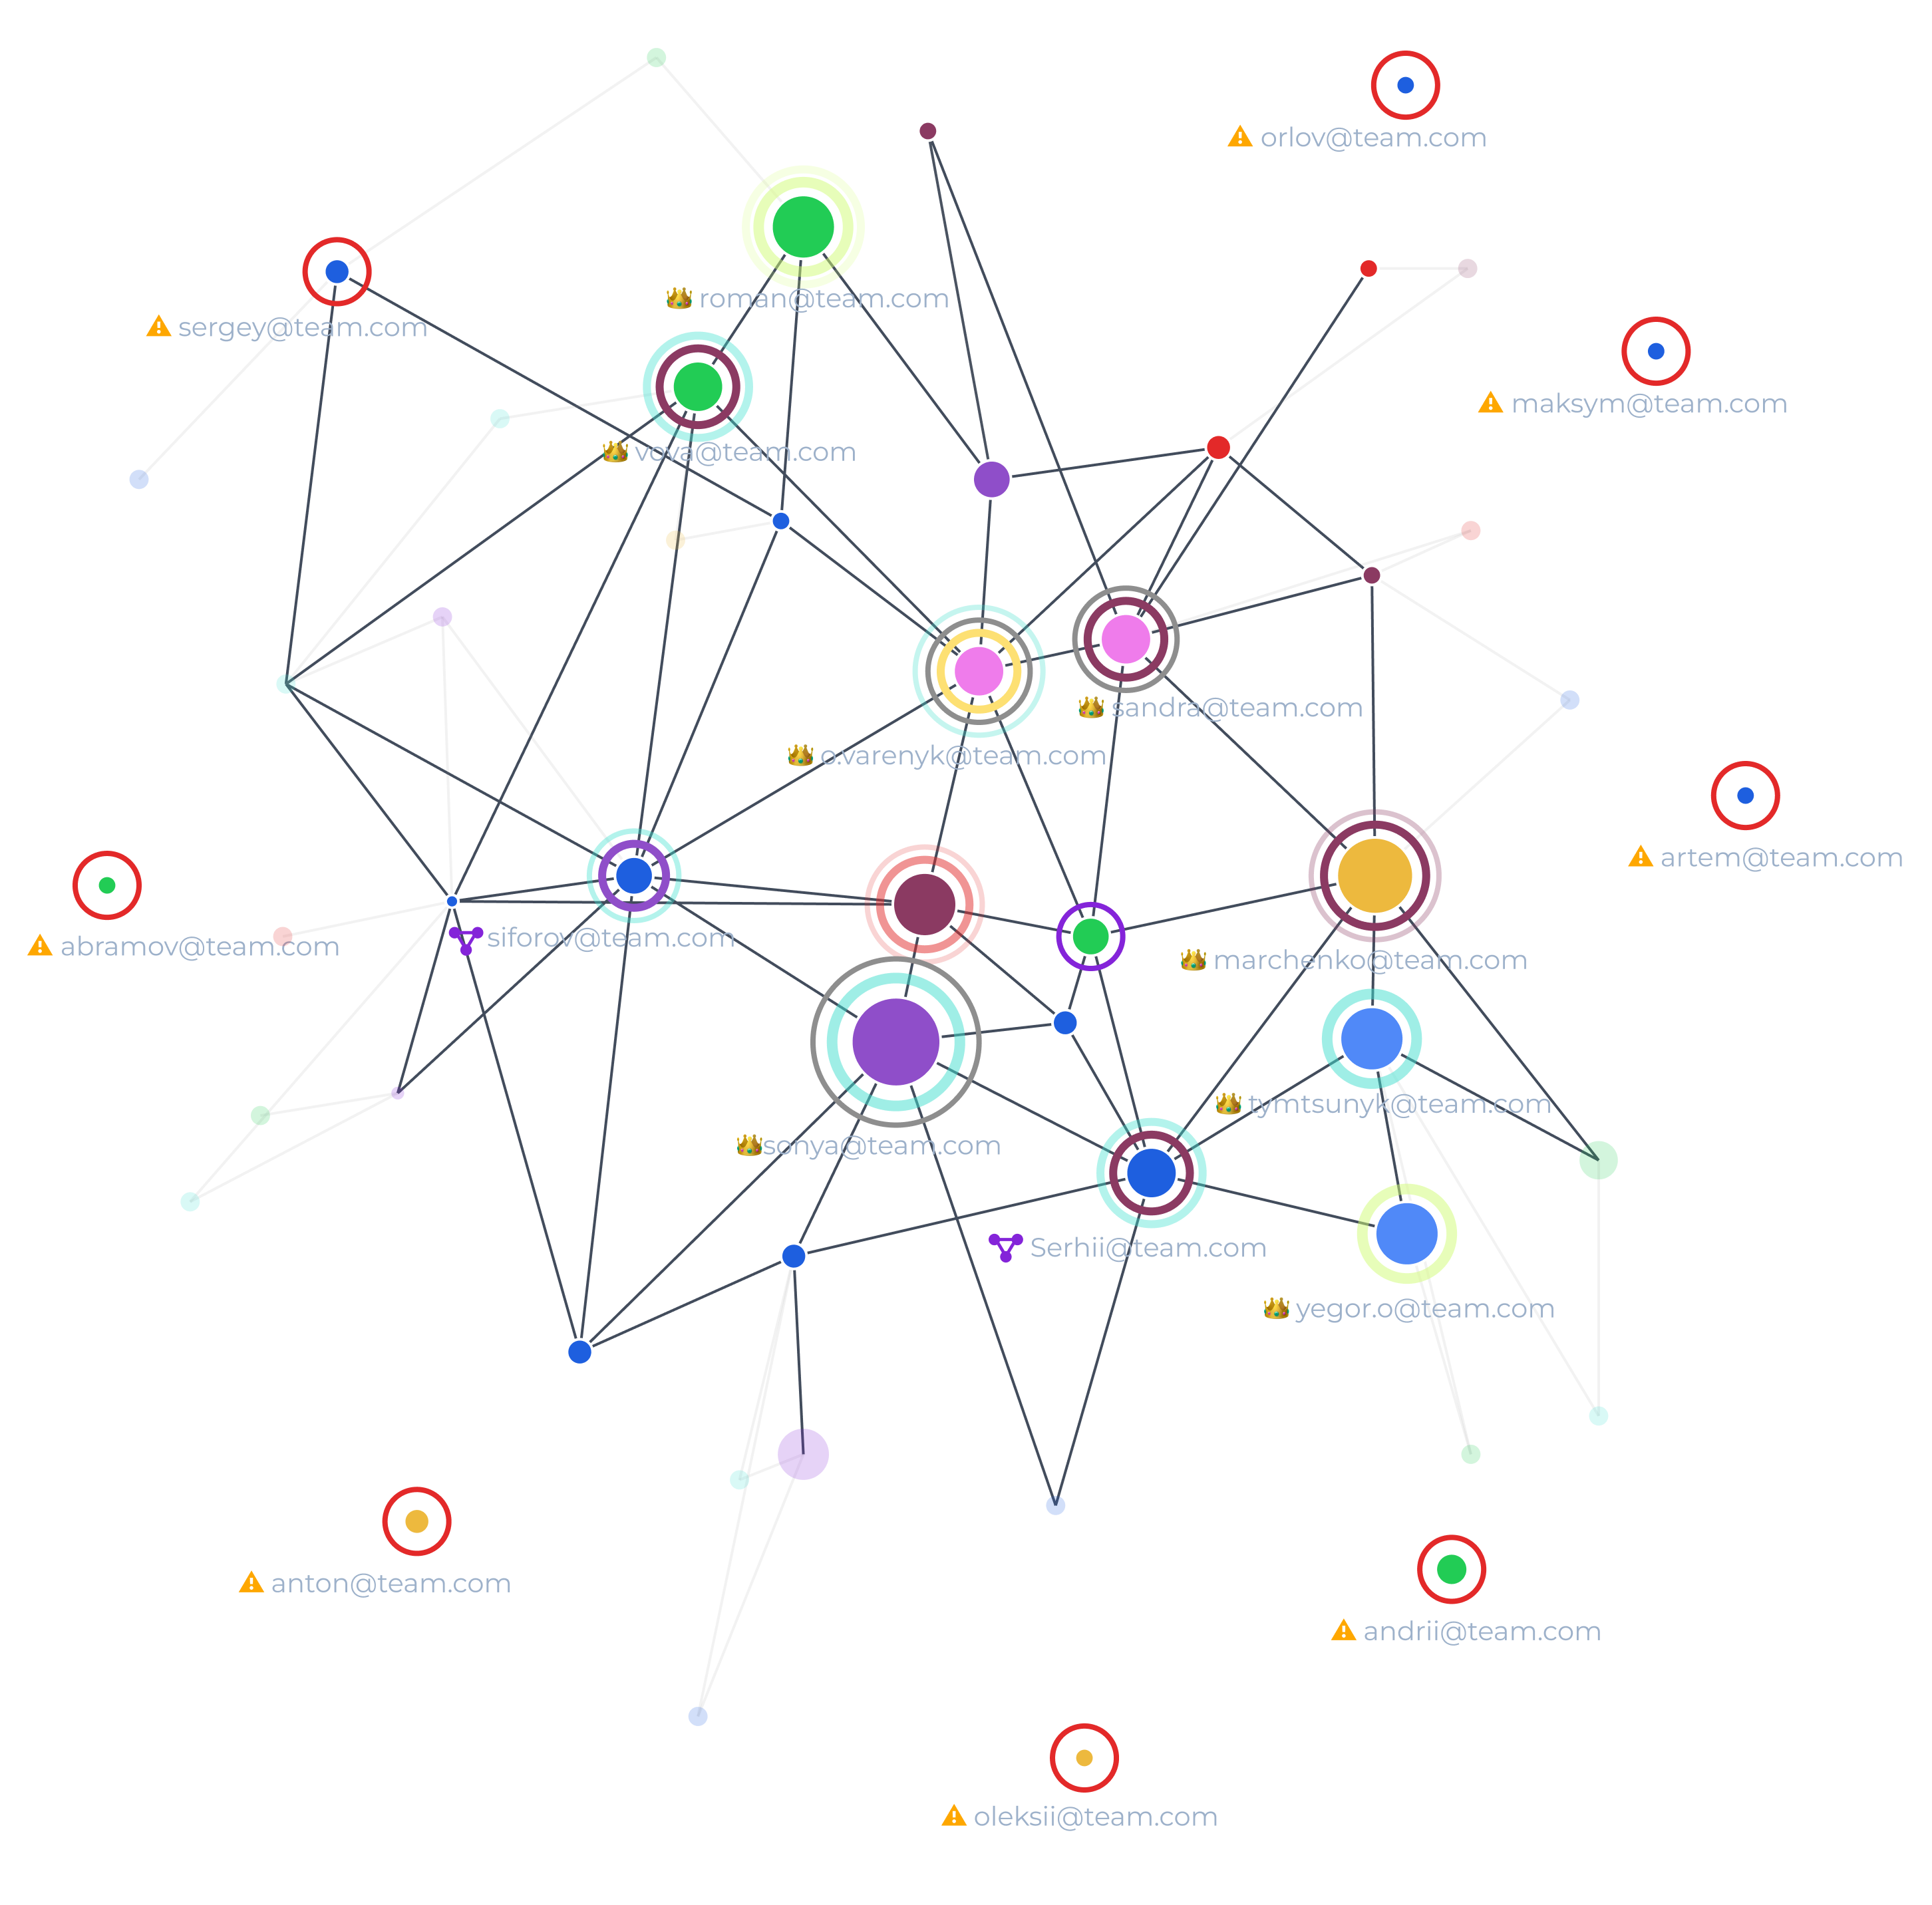
Connection map
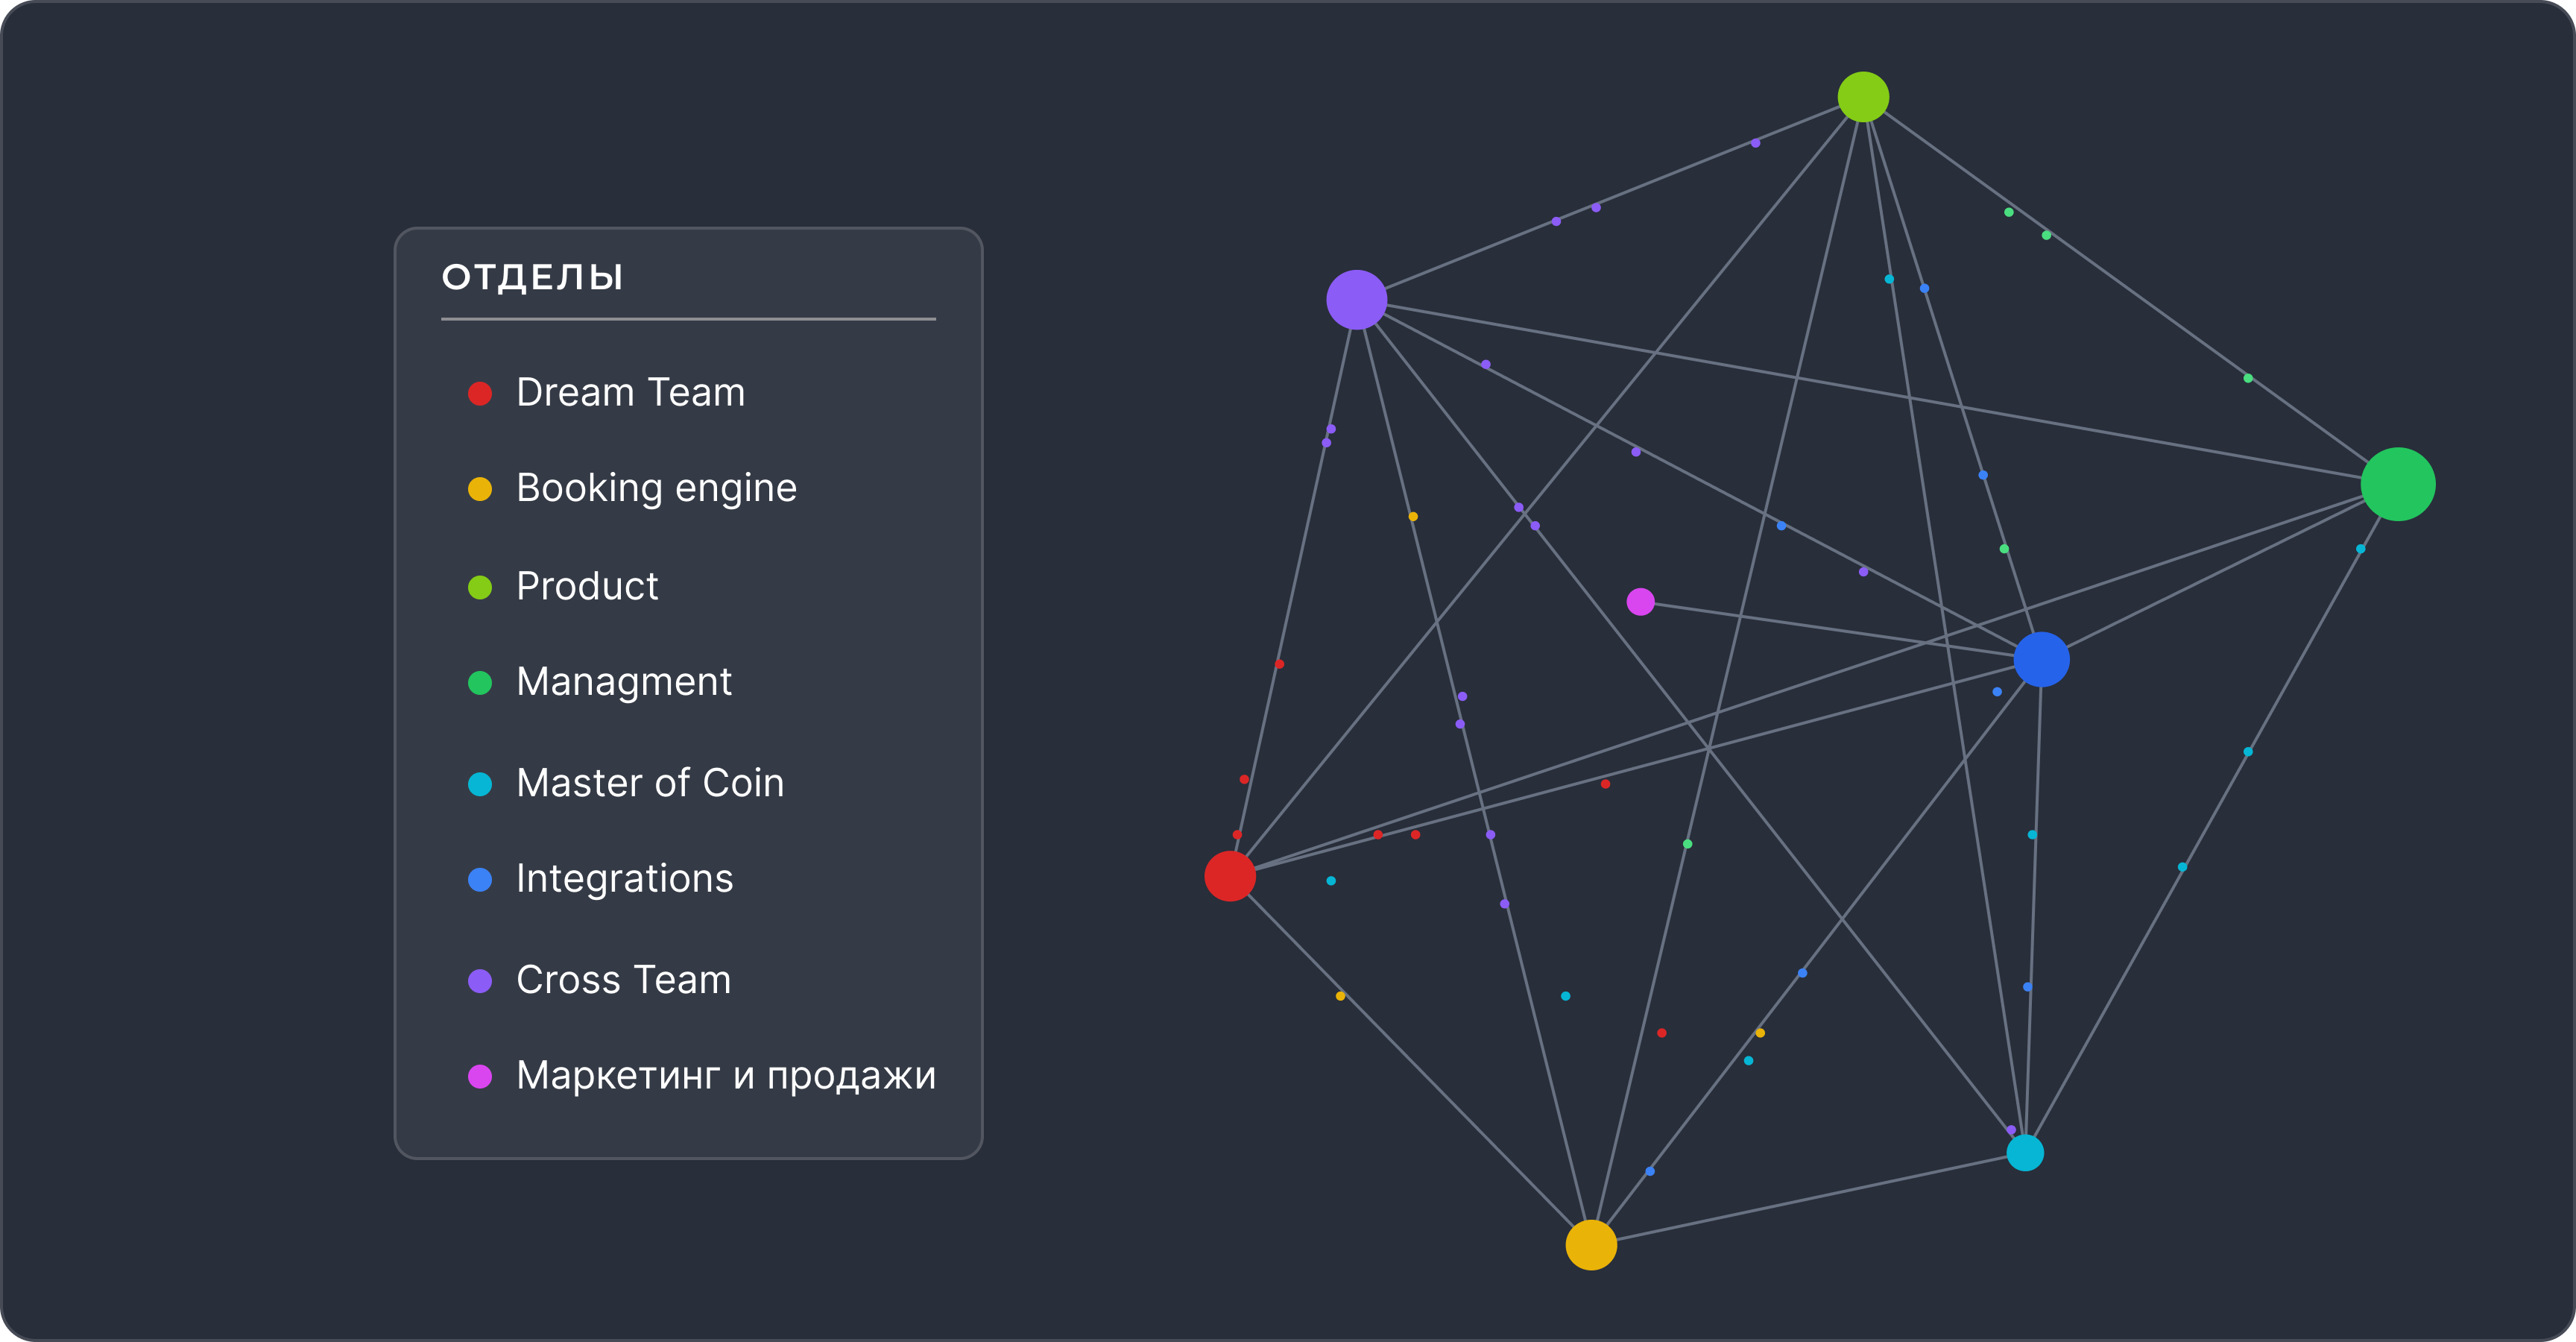
Which departments interact, where strong bridges exist, and where teams are isolated.
Action priorities
Which ideas, problems, and connections should be addressed first.
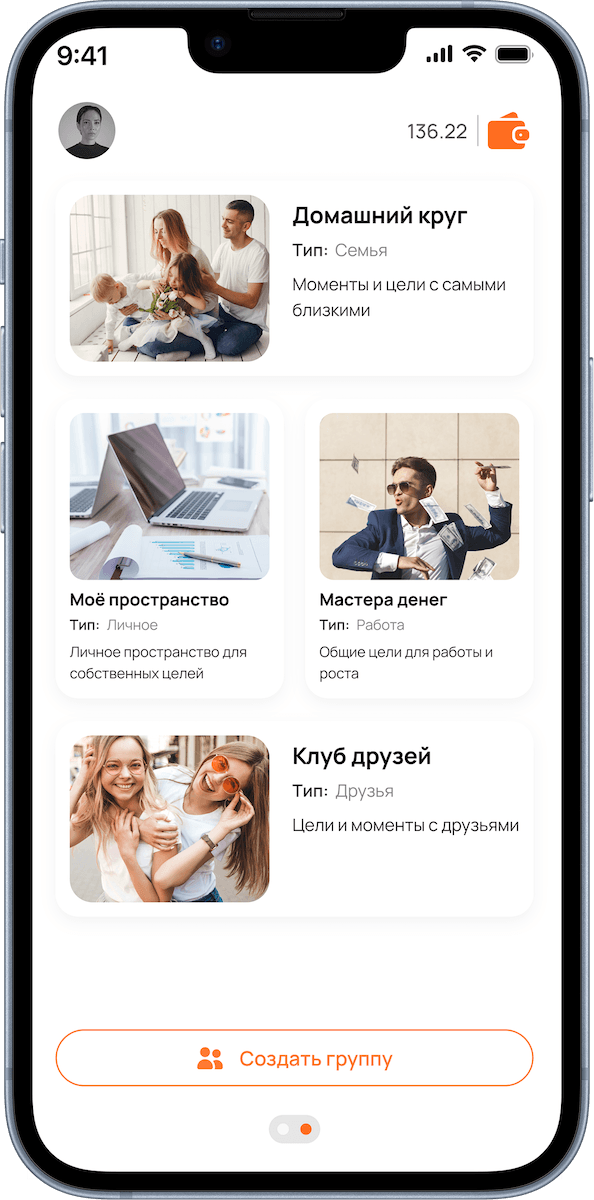
Dashboard screenshot

Connection map and team segments in the management dashboard.

Contribution map screenshot

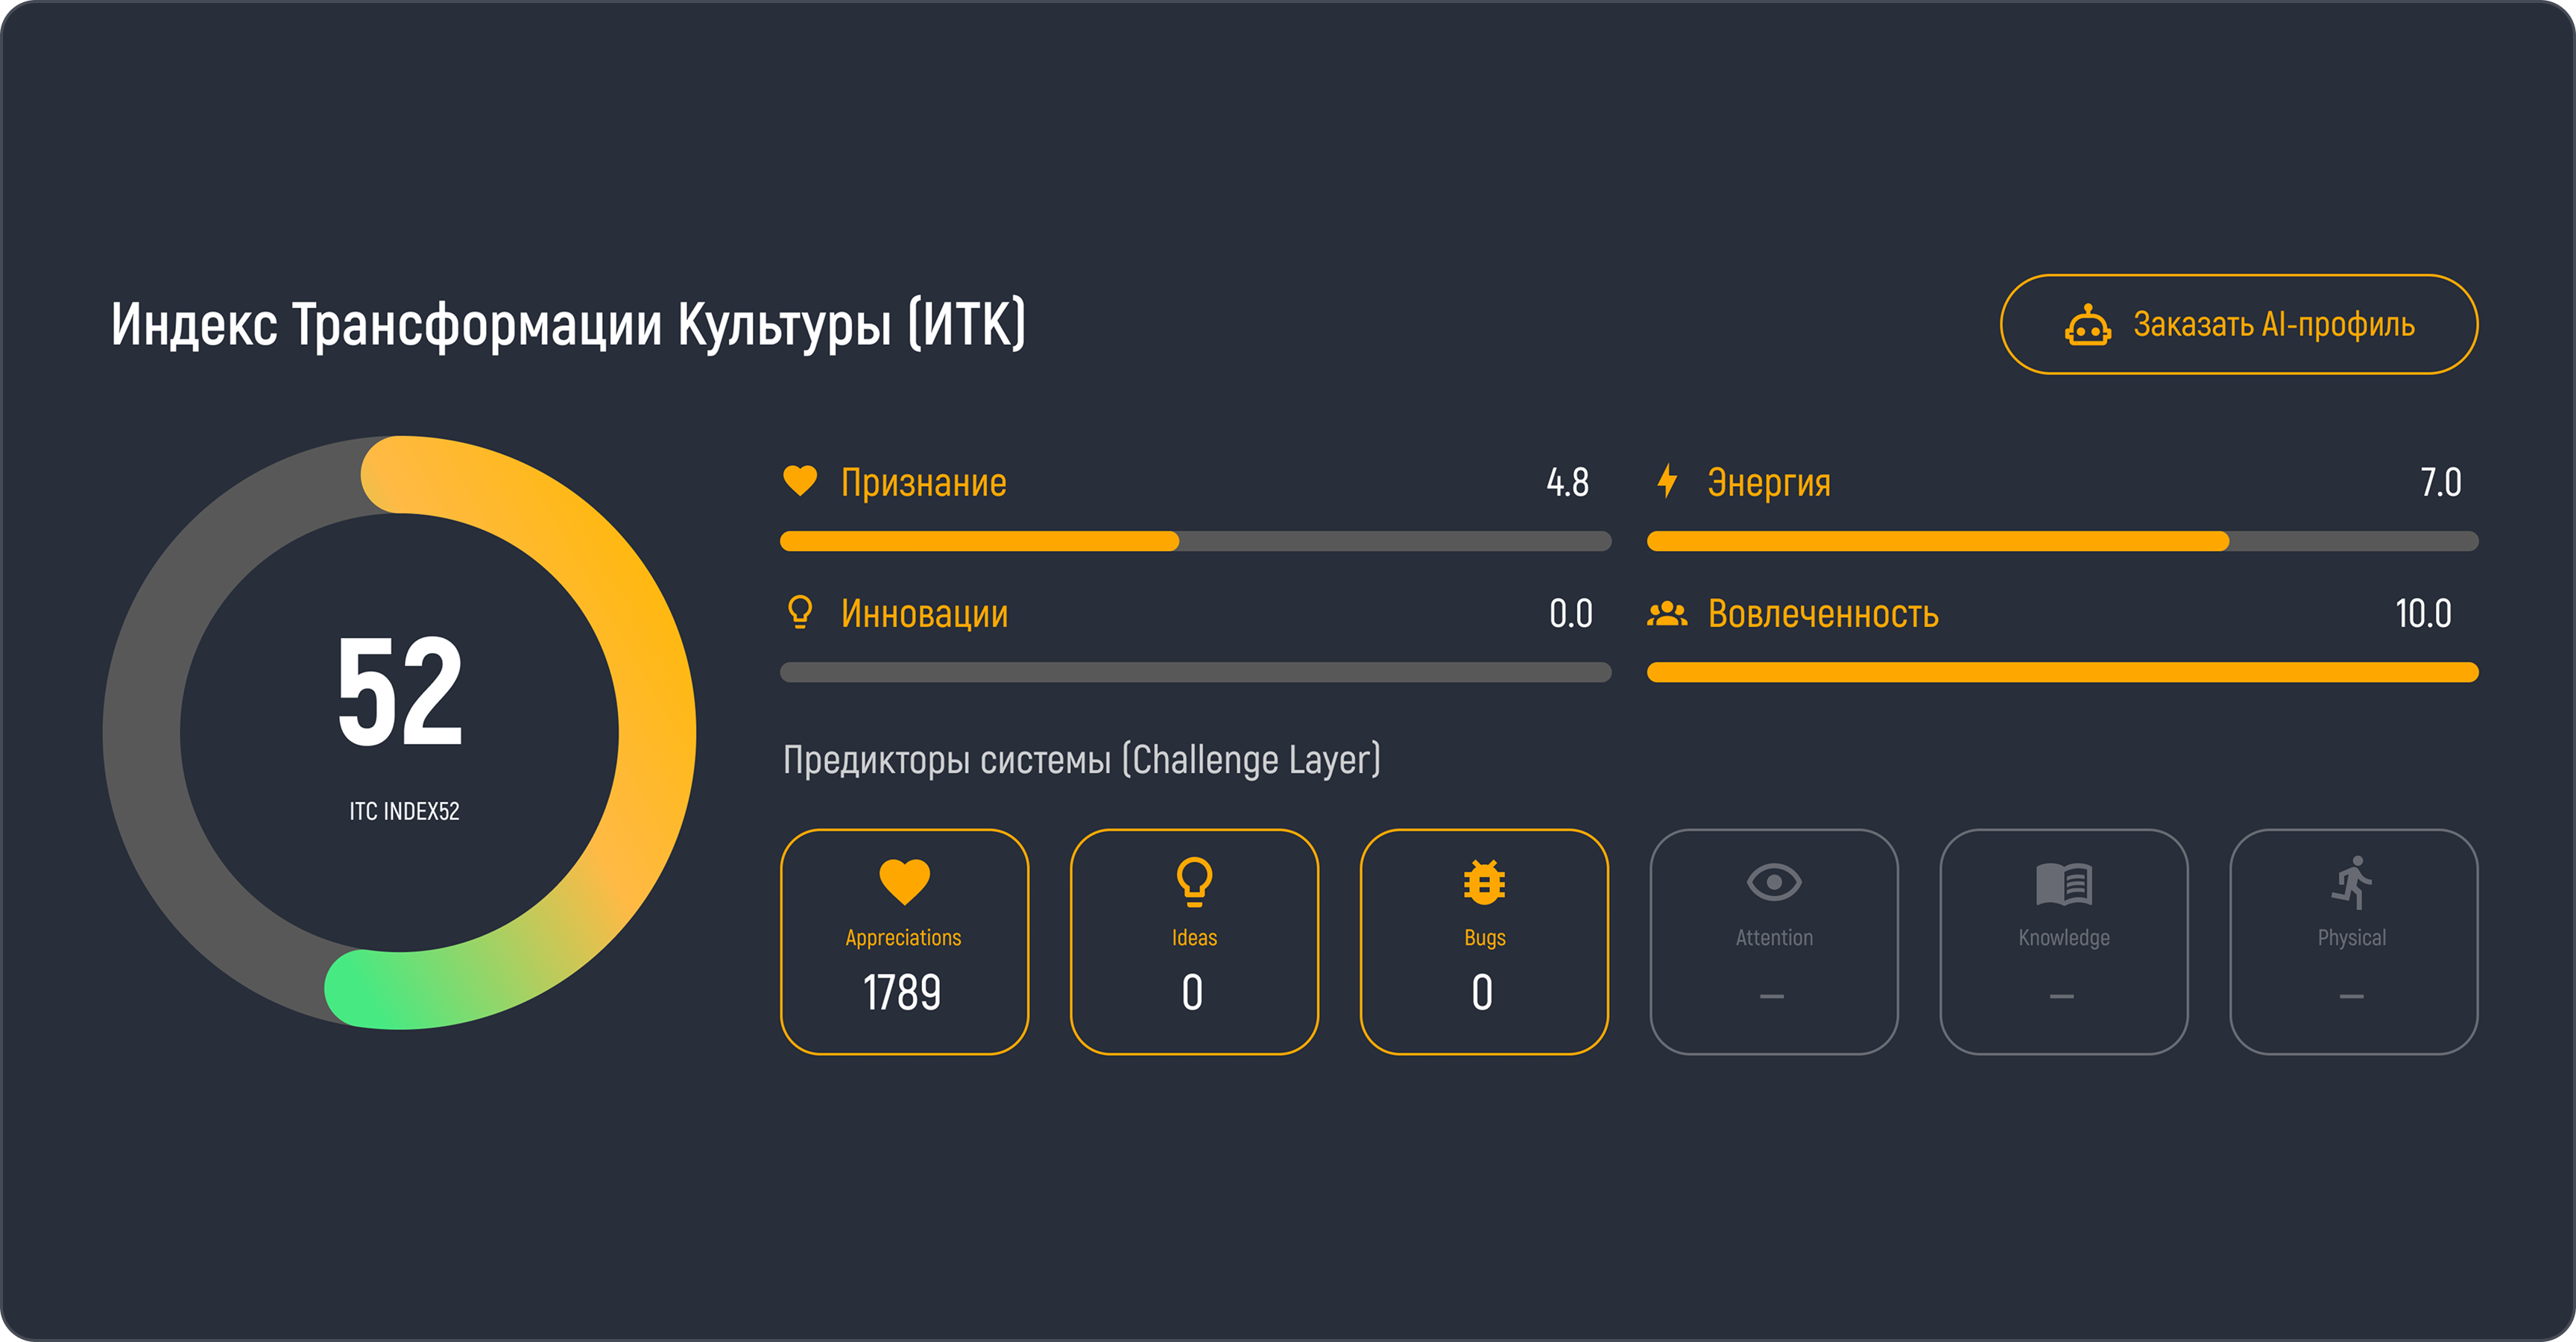
Radar, scores, and employee contribution based on real actions.

Employee analytics screenshot

Comparison of employees, connections, and influence zones.

Employee profile screenshot

Employee profile: contribution, roles, skills, and signal history.

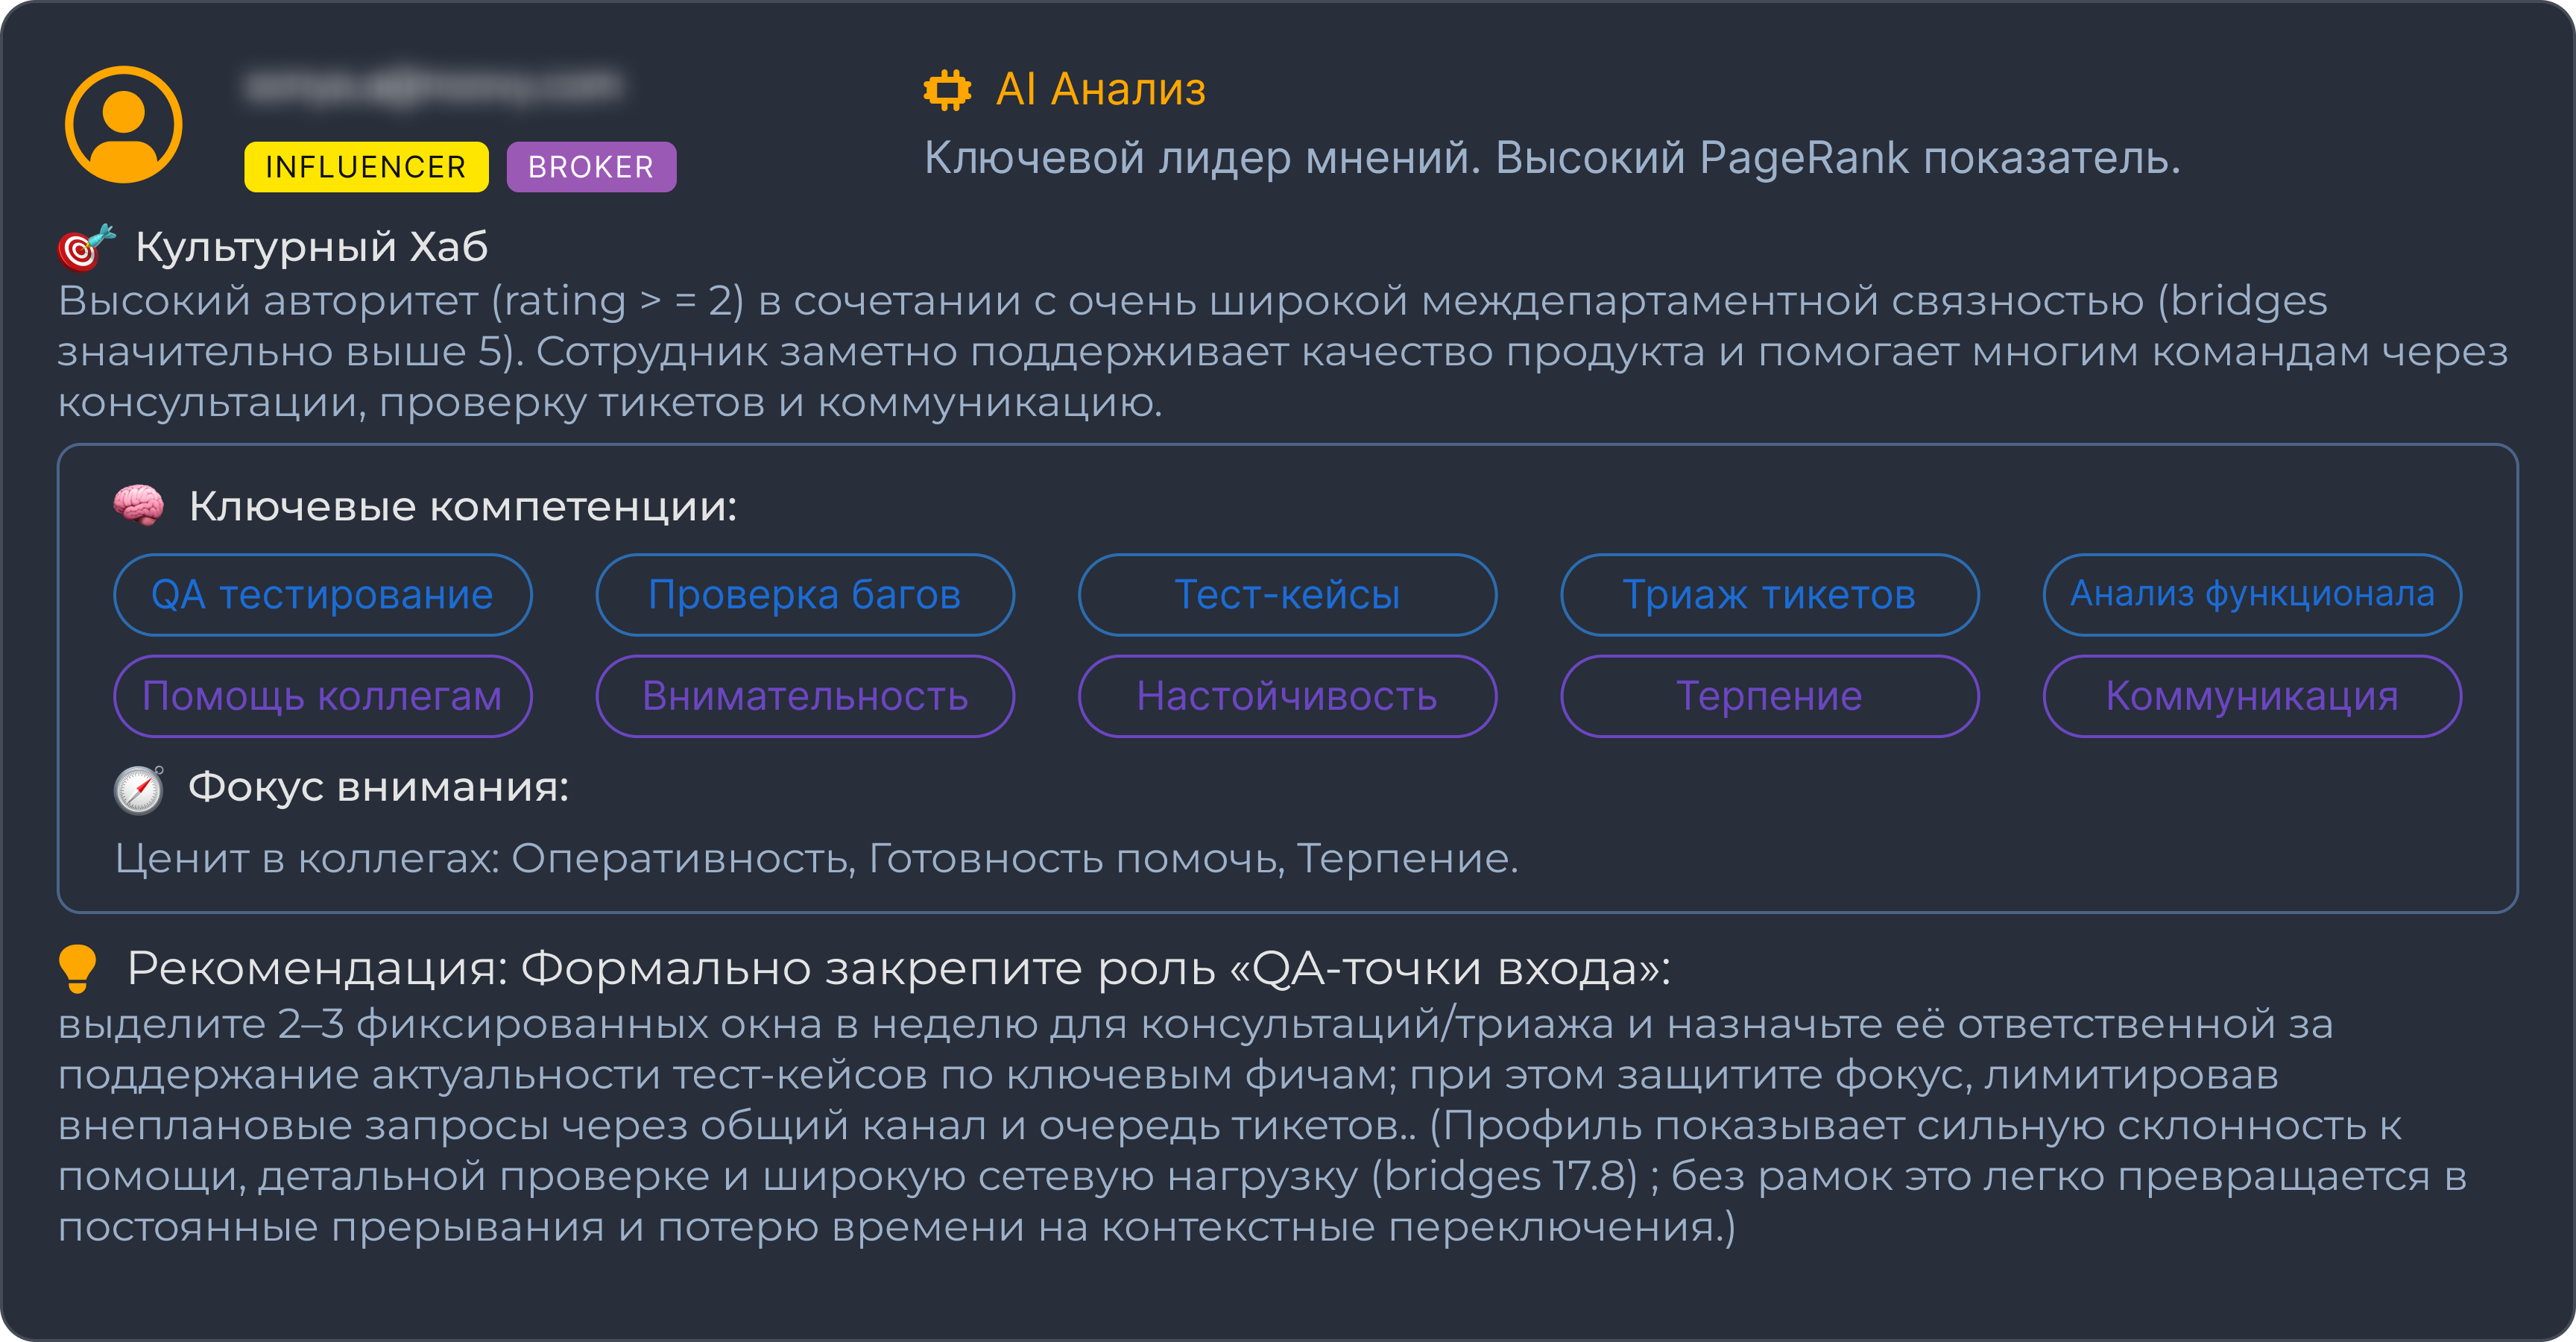
AI analysis screenshot

AI analysis of thanks, ideas, and problems in one screen.

30 days. One team. Three data streams.

Launch HiveHR with one team and get a map of real contribution, connections, ideas, problems, and risk zones.

Days 1-3

Setup

Employee upload, rules, and launch texts.

Week 1

First signals

Thanks, ideas, and highlighted problems.

Weeks 2-4

Patterns

Data accumulation and interim insights.

Day 30

Final report

Connection map, employee contribution, risks, and recommendations.

In 30 days, not an activity report. A map of management decisions.

HiveHR will show who to support, where to strengthen connections, which problems to address first, and who the team truly depends on.

Start pilot